







 Intirety
The July Market Insights highlights a growing disconnect between headline market strength and underlying market conditions. While major indexes remain near record highs, numerous historical indicators, including record margin debt, extreme momentum, weakening market breadth, elevated AI-related concentration, and mounting stresses in private credit suggest investor optimism and speculation have reached historically elevated levels. At the same time, many speculative stocks and sectors have already entered bear markets beneath the surface, despite the resilience of the major indexes. Given these conditions, we believe investors should remain disciplined, avoid chasing speculative market leadership, and instead focus on resilient, value-oriented investments, defensive sectors, and maintaining adequate liquidity while monitoring for signs that today's market extremes begin to unwind.
Market Overview
Reaching New Historic Extremes
Several key indicators suggest investor optimism has reached historically elevated levels. Margin debt as a percentage of GDP recently climbed to a new all-time high, signaling that investors are using record amounts of borrowed money to participate in the market. At the same time, momentum indicators, which measure the performance of the market's strongest-performing stocks, have accelerated to levels not seen in more than 30 years. Together, these trends reflect growing confidence that the current market leadership and favorable conditions will continue indefinitely.
While these indicators do not predict the exact timing of a market reversal, history shows that similar extremes have often occurred during the later stages of bull markets. Elevated leverage and concentrated momentum can leave markets more vulnerable if investor sentiment shifts, as forced selling and unwinding of leveraged positions can amplify volatility. Although the long-term outlook for equities remains constructive, today's environment reinforces the importance of maintaining a disciplined investment approach, emphasizing diversification, risk management, and avoiding the temptation to chase speculative market trends.
AI: Hype Meets Reality
Another emerging market risk is the unprecedented concentration and interconnectedness among the largest U.S. companies, many of which are heavily dependent on continued AI investment and the eventual profitability of the technology. Unlike previous market cycles where the largest companies represented a broad range of industries, today's market leadership is increasingly concentrated within technology and communications, with many of the largest companies linked through shared customers, investments, and partnerships tied to the AI expansion.
The scale of investment required to build AI infrastructure is also creating new challenges. Major cloud computing companies are committing hundreds of billions of dollars toward data centers and AI capabilities, significantly increasing capital spending and reducing free cash flow. While these investments could generate substantial long-term opportunities, expectations remain extremely high. If AI adoption or profitability develops more slowly than anticipated, the companies driving the market higher could face increased pressure, potentially impacting broader market performance. As a result, monitoring AI-related market leadership will remain an important indicator of overall investor confidence and market direction.
Private Credit: A Growing Risk on the Horizon
As the AI investment boom continues to drive capital into private markets, concerns are growing around the rapid expansion of private credit. Regulators and investors are increasingly questioning the transparency, liquidity, and underlying risks within these funds, particularly as redemption requests have risen and many funds lack the liquidity to meet withdrawals beyond their limits. While private credit has provided attractive returns in recent years, growing signs of stress suggest that investor confidence is being tested. Monitoring developments in this space will be important, as a significant deterioration in private credit markets could create broader challenges for financial markets and investor portfolios.
The Hidden Speculative Bear Market
While major market indexes remain near all-time highs, significant weakness is developing beneath the surface. A growing number of individual stocks, particularly within technology and speculative areas of the market, have already entered bear market territory, with many popular names experiencing substantial declines from their peaks. Speculative assets, including cryptocurrencies and high-growth companies tied to emerging themes such as artificial intelligence, have faced notable selling pressure as investor enthusiasm has cooled. Although these losses remain largely hidden within the broader indexes, the widening gap between headline market performance and underlying market health highlights the importance of disciplined risk management. History suggests that when weakness spreads beneath the surface, broader market volatility can follow.
Investment Strategy Update
Staying Focused on Resilience
The recent market volatility and rapid shifts in sector leadership reinforce the importance of maintaining a disciplined, long-term investment approach. After a difficult first quarter for speculative and AI-related investments, the market experienced a sharp rotation back toward technology and growth stocks in the second quarter, creating a short-term rally driven by strong momentum. However, leadership has already begun shifting again, highlighting the challenges of navigating a market driven by changing sentiment and speculation.
Rather than chasing short-term trends, we remain focused on resilient, value-oriented investments with attractive long-term opportunities. We continue to avoid the most speculative areas of the market while seeking opportunities in undervalued segments, including select U.S. companies and international markets where valuations are more compelling. Our portfolios also maintain a defensive posture with exposure to resilient sectors and, in some cases, a meaningful allocation to cash equivalents, providing flexibility as market conditions continue to evolve.
Portfolio Allocation Update
Fixed Income: Our fixed income positioning remains with short-term treasuries and money markets. Short-term treasuries provide a more defensive and flexible approach within the fixed income portion of the portfolios compared to long-term bonds. Because they mature quickly, they carry lower interest rate and duration risk, helping reduce price volatility and preserve capital during periods of rising rates or economic uncertainty. In higher-rate environments, short-term treasuries can deliver competitive yields without the added volatility often associated with longer-duration bonds.
Equities: We recently increased the allocation to Mid-Cap Value due to the attractive valuation. Supported by strong fundamentals and favorable valuation characteristics, we are modestly increasing the allocation from 5% to 7% as part of our broader emphasis on selective value opportunities and disciplined portfolio positioning.
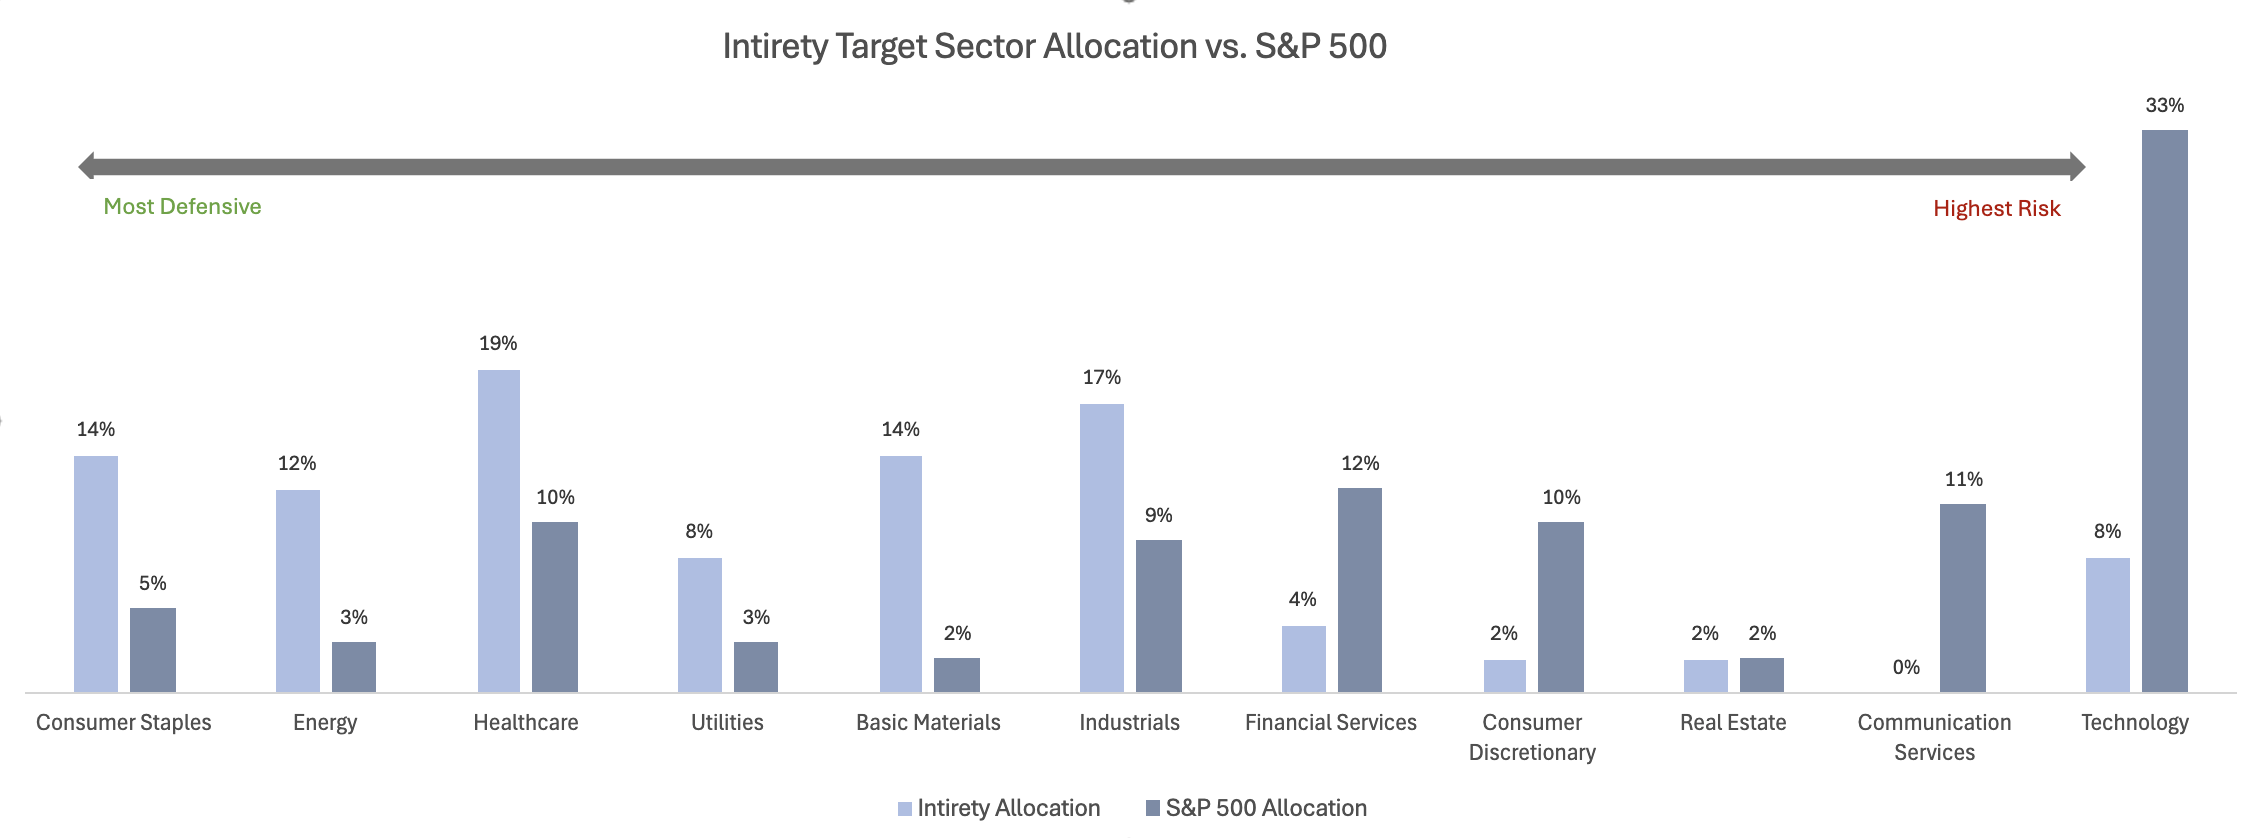
Disclaimer: The target portfolio allocation is a target model and used as a blueprint. Investment account allocations may vary depending on investment risk and fund options available within a plan. Investment accounts may not align exactly with the target allocation.
Washington State DRS News
The 2026 legislative session includes several proposed bills focused on public retirement systems and pension-related benefits. Key measures under consideration address cost-of-living adjustments and benefit increases for retirees, lump-sum retirement payment thresholds, pension eligibility for certain public employees and firefighters, medical insurance reimbursements for surviving spouses of line-of-duty deaths, and changes affecting retirement salary calculations and post retirement employment rules for law enforcement personnel. These proposals could have fiscal and operational impacts on Washington State retirement systems and public employees.
Disclosure
The content is developed from sources believed to be providing accurate information. The information in this material is not intended as tax or legal advice. Please consult legal or tax professionals for specific information regarding your individual situation. This material was developed and produced by Intirety, LLC to provide information on a topic that may be of interest. The opinions expressed and material provided are for general information and should not be considered a solicitation for the purchase or sale of any security.
Investing involves risks, and investment decisions should be based on your own goals, time horizon and tolerance for risk. The return and principal value of investments will fluctuate as market conditions change. When sold, investments may be worth more or less than their original cost.
Any companies mentioned are for illustrative purposes only. It should not be considered a solicitation for the purchase or sale of the securities. Any investment should be consistent with your objectives, timeframe, and risk tolerance.
The forecasts or forward-looking statements are based on assumptions, subject to revision without notice, and may not materialize.
The market indexes discussed are unmanaged and generally considered representative of their respective markets. Individuals cannot directly invest in unmanaged indexes. Past performance does not guarantee future results.
The Dow Jones Industrial Average is an unmanaged index that is generally considered representative of large-capitalization companies on the U.S. stock market. The S&P 500 Composite Index is an unmanaged group of securities considered to be representative of the stock market in general. The Nasdaq Composite is an index of the common stocks and similar securities listed on the Nasdaq stock market and considered a broad indicator of the performance of stocks of technology and growth companies. The Russell 1000 Index is an index that measures the performance of the highest-ranking 1,000 stocks in the Russell 3000 Index, which is comprised of 3,000 of the largest U.S. stocks. The MSCI EAFE Index was created by Morgan Stanley Capital International (MSCI) and serves as a benchmark for the performance in major international equity markets, as represented by 21 major MSCI indexes from Europe, Australia, and Southeast Asia. Index performance is not indicative of the past performance of a particular investment. The S&P/TSX Composite Index is the benchmark Canadian stock market index representing roughly 70% of the total market capitalization on the Toronto Stock Exchange (TSX). Past performance does not guarantee future results. Individuals cannot invest directly in an index. The return and principal value of stock prices will fluctuate as market conditions change. And shares, when sold, may be worth more or less than their original cost.
International investments carry additional risks, which include differences in financial reporting standards, currency exchange rates, political risks unique to a specific country, foreign taxes and regulations, and the potential for illiquid markets. These factors may result in greater share price volatility.
The Hang Seng Index is a benchmark index for the blue-chip stocks traded on the Hong Kong Stock Exchange. The KOSPI is an index of all stocks traded on the Korean Stock Exchange. The Nikkei 225 is a stock market index for the Tokyo Stock Exchange. The SENSEX is a stock market index of 30 companies listed on the Bombay Stock Exchange. The Jakarta Composite Index is an index of all stocks that are traded on the Indonesia Stock Exchange. The Bovespa Index tracks 50 stocks traded on the Sao Paulo Stock, Mercantile, & Futures Exchange. The IPC Index measures the companies listed on the Mexican Stock Exchange. The MERVAL tracks the performance of large companies based in Argentina. The ASX 200 Index is an index of stocks listed on the Australian Securities Exchange. The DAX is a market index consisting of the 40 German companies trading on the Frankfurt Stock Exchange. The CAC 40 is a benchmark for the 40 most significant companies on the French Stock Market Exchange. The Dow Jones Russia Index measures the performance of leading Russian Global Depositary Receipts (GDRs) that trade on the London Stock Exchange. The FTSE 100 Index is an index of the 100 companies with the highest market capitalization listed on the London Stock Exchange.
Please consult your financial professional for additional information.
Sources: Investech Research, Washington State DRS