







 Intirety
The August insights presents a market environment where continued economic growth and positive market momentum are being balanced by historically elevated valuations, concentrated leadership among large U.S. companies, increased investor leverage, persistent inflation, and emerging signs of pressure on consumers and the labor market. While manufacturing and service activity remain in expansion territory and major indexes continue to trade near record highs, the report emphasizes the importance of remaining disciplined as the economic cycle matures. From an investment perspective, the overall approach favors staying invested while maintaining broad diversification across quality equities, value and dividend-oriented companies, defensive sectors, international markets, fixed income, and liquidity, providing participation in continued market growth while helping manage the risks associated with elevated valuations and potential volatility.
Market Overview
OVERVALUATION
U.S. stock valuations remain historically elevated across several widely followed measures. Market capitalization relative to GDP is in the 99th percentile of its historical range, while the S&P 500 price-to-sales ratio is in the 100th percentile. Traditional price-to-earnings stands at 26.2 compared with a historical average of 17.8, placing it in the 90th percentile. Collectively, these measures indicate that investors are paying considerably more for corporate sales, earnings, and economic output than historical norms.
Longer-term measures tell a similar story. The cyclically adjusted price-to-earnings ratio, or CAPE, stands at 41.2 compared with a historical average of 18.6, placing it in the 99th percentile and near levels last experienced around the late-1990s technology boom. Elevated valuations do not necessarily mean a market decline is imminent, but they can leave less room for disappointment if earnings growth slows, interest rates remain elevated, or investor sentiment changes.
MARKET CONCENTRATION
Market concentration has reached unusually high levels, with a relatively small group of companies accounting for an increasingly large portion of major U.S. indexes. The ten largest companies currently represent approximately 40% of the S&P 500 and 56% of the Nasdaq Composite. Because these indexes are weighted by market capitalization, the performance of a handful of very large companies can have an outsized influence on overall index returns.
Strong performance from large technology and growth companies has been an important contributor to the market's advance, but this concentration also creates additional risk. If leadership broadens to other companies and sectors, it could provide healthier support for the overall market. Conversely, weakness among today's largest companies could have a disproportionate effect on the major indexes, reinforcing the importance of diversification beyond recent market leaders.
INVESTOR LEVERAGE
Investor use of leverage has increased considerably. Assets in bullish leveraged ETFs grew from approximately $123 billion in 2022 to $497 billion in 2026, an increase of more than 300%. These investments can magnify gains by providing two or three times the exposure to individual stocks, indexes, or investment themes, but the same leverage can accelerate losses when markets move in the opposite direction.
Margin borrowing provides another indication of investor risk-taking. Margin debt relative to GDP increased nearly 20% during the first six months of 2026 before declining 6% in July, its largest monthly decline in nearly three years. Elevated leverage does not necessarily cause market declines, but it can increase volatility because falling markets may force leveraged investors to reduce positions, potentially amplifying downward market movements.
BULL MARKET CONTINUES
Despite concerns surrounding valuations, concentration, and leverage, market momentum remains positive. Many of the large companies responsible for leading the market higher continue to trade near their highs. Because these companies represent a significant portion of the S&P 500, their continued strength remains an important source of support for the broader market.
Economic conditions also remain supportive. The ISM Manufacturing Purchasing Managers Index recently increased to 55.6%, its highest level in more than four years, while the Services PMI stands at 54.1%. Readings above 50 indicate expansion, suggesting both major areas of the economy continue to grow. The combination of positive market momentum and continued economic expansion provides an important counterbalance to concerns surrounding elevated valuations.
LABOR MARKET CHALLENGES
The labor market is beginning to show signs of slowing. Nonfarm payrolls declined by 23,000 jobs in July, continuing a broader moderation in employment growth. At the same time, labor-force participation declined, meaning fewer working-age Americans are actively participating in the labor market. Although unemployment fell from 4.2% to 4.1%, lower participation complicates the picture because individuals who stop looking for work are no longer counted as unemployed.
Businesses are simultaneously reporting continued difficulty finding qualified workers. Small-business survey data showed a significant increase in owners identifying labor quality or availability as a major concern. The combination of slower employment growth, declining participation, and persistent labor shortages creates a challenging environment for policymakers attempting to balance employment conditions with inflation.
LABOR MARKET CHALLENGES
Consumers are showing increasing signs of financial pressure following several years of elevated inflation. Only 8% of consumers surveyed expect wage growth to outpace inflation during the coming year. Mortgage delinquencies of at least 30 days have reached their highest level in a decade, while serious auto-loan delinquencies have risen to their highest level since 2010.
The economy continues to expand, but these developments suggest the current economic cycle is becoming more mature. Consumer spending has been an important source of economic resilience, making household finances an important area to monitor. Further deterioration in consumer confidence, purchasing power, or credit conditions could eventually contribute to slower economic growth.
INFLATION & INTEREST RATES
Inflation remains above the Federal Reserve's long-term 2% objective. Although several recent inflation readings have moderated, core PCE, the measure excluding food and energy, stands at 3.3%. The persistence of underlying inflation suggests the path toward the Fed's target may remain uneven.
This creates a difficult interest-rate environment. Policymakers must balance persistent inflation against signs of moderation in employment and increasing pressure on consumers. Continued improvement in inflation could eventually provide greater flexibility for monetary policy, while renewed inflationary pressure could keep interest rates elevated for longer.
CONSUMER OUTLOOK
Consumers are showing increasing signs of financial pressure following several years of elevated inflation. Only 8% of consumers surveyed expect wage growth to outpace inflation during the coming year. Mortgage delinquencies of at least 30 days have reached their highest level in a decade, while serious auto-loan delinquencies have risen to their highest level since 2010.
The economy continues to expand, but these developments suggest the current economic cycle is becoming more mature. Consumer spending has been an important source of economic resilience, making household finances an important area to monitor. Further deterioration in consumer confidence, purchasing power, or credit conditions could eventually contribute to slower economic growth.
Investment Strategy Update
STAYING FOCUSED & RESILIENT
With U.S. valuations elevated and major indexes increasingly concentrated, diversification remains particularly important. International equities represent one potential source of diversification, with some markets trading at considerably lower valuations than the U.S. International exposure can also reduce dependence on the technology and communication-services companies that currently represent a significant portion of the U.S. large-cap market.
A balanced approach can include exposure to value-oriented companies, defensive sectors, international markets, high-quality fixed income, and adequate liquidity alongside long-term growth investments. Rather than attempting to predict when market leadership will change, the objective is to participate in continued market appreciation while maintaining sufficient diversification to manage periods of increased volatility.
Portfolio Allocation Update
REMAINING DISCIPLINED
Fixed Income: We maintain a meaningful defensive allocation, with a third in short-term investment grade bonds and short-term Treasuries. This positioning provides liquidity, generates income, and helps reduce overall portfolio volatility while preserving flexibility to take advantage of future investment opportunities if market conditions become more attractive.
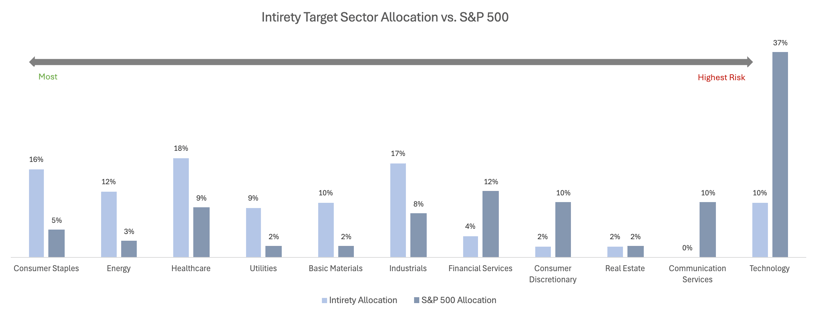
Equities: The equity allocation remains broadly diversified across healthcare, industrials, consumer staples, energy, utilities, dividend-paying companies, value-oriented investments, international markets, and select real assets. The overall approach emphasizes quality, reasonable valuations, and diversification beyond the highly concentrated areas of the U.S. market, while maintaining enough equity exposure to participate in continued long-term market growth.
Disclaimer: The target portfolio allocation is a target model and used as a blueprint. Investment account allocations may vary depending on investment risk and fund options available within a plan. Investment accounts may not align exactly with the target allocation.
Washington State DRS News
STAY IN THE KNOW
Starting a new job in Washington public service means you’re already earning a valuable retirement benefit. While the amount of information about DRS can feel overwhelming, understanding your plan early can help you make better decisions throughout your career. Depending on your employer, you may be automatically enrolled or have a limited window to choose a plan. DRS administers several retirement systems, including PERS, TRS, SERS, LEOFF, WSPRS, and PSERS, with plans generally designated as Plan 1, 2, or 3. Each plan has different rules for contributions, retirement eligibility, and benefits, so it’s important to know which plan you have. You can create your DRS online account after receiving your first paycheck to view your benefits, manage your account, and designate beneficiaries. You may also have access to the Deferred Compensation Program (DCP), a voluntary savings program that can supplement your pension. The sooner you understand your benefits, the better positioned you’ll be to make your retirement plan work for you.
Disclosure
The content is developed from sources believed to be providing accurate information. The information in this material is not intended as tax or legal advice. Please consult legal or tax professionals for specific information regarding your individual situation. This material was developed and produced by Intirety, LLC to provide information on a topic that may be of interest. The opinions expressed and material provided are for general information and should not be considered a solicitation for the purchase or sale of any security.
Investing involves risks, and investment decisions should be based on your own goals, time horizon and tolerance for risk. The return and principal value of investments will fluctuate as market conditions change. When sold, investments may be worth more or less than their original cost.
Any companies mentioned are for illustrative purposes only. It should not be considered a solicitation for the purchase or sale of the securities. Any investment should be consistent with your objectives, timeframe, and risk tolerance.
The forecasts or forward-looking statements are based on assumptions, subject to revision without notice, and may not materialize.
The market indexes discussed are unmanaged and generally considered representative of their respective markets. Individuals cannot directly invest in unmanaged indexes. Past performance does not guarantee future results.
The Dow Jones Industrial Average is an unmanaged index that is generally considered representative of large-capitalization companies on the U.S. stock market. The S&P 500 Composite Index is an unmanaged group of securities considered to be representative of the stock market in general. The Nasdaq Composite is an index of the common stocks and similar securities listed on the Nasdaq stock market and considered a broad indicator of the performance of stocks of technology and growth companies. The Russell 1000 Index is an index that measures the performance of the highest-ranking 1,000 stocks in the Russell 3000 Index, which is comprised of 3,000 of the largest U.S. stocks. The MSCI EAFE Index was created by Morgan Stanley Capital International (MSCI) and serves as a benchmark for the performance in major international equity markets, as represented by 21 major MSCI indexes from Europe, Australia, and Southeast Asia. Index performance is not indicative of the past performance of a particular investment. The S&P/TSX Composite Index is the benchmark Canadian stock market index representing roughly 70% of the total market capitalization on the Toronto Stock Exchange (TSX). Past performance does not guarantee future results. Individuals cannot invest directly in an index. The return and principal value of stock prices will fluctuate as market conditions change. And shares, when sold, may be worth more or less than their original cost.
International investments carry additional risks, which include differences in financial reporting standards, currency exchange rates, political risks unique to a specific country, foreign taxes and regulations, and the potential for illiquid markets. These factors may result in greater share price volatility.
The Hang Seng Index is a benchmark index for the blue-chip stocks traded on the Hong Kong Stock Exchange. The KOSPI is an index of all stocks traded on the Korean Stock Exchange. The Nikkei 225 is a stock market index for the Tokyo Stock Exchange. The SENSEX is a stock market index of 30 companies listed on the Bombay Stock Exchange. The Jakarta Composite Index is an index of all stocks that are traded on the Indonesia Stock Exchange. The Bovespa Index tracks 50 stocks traded on the Sao Paulo Stock, Mercantile, & Futures Exchange. The IPC Index measures the companies listed on the Mexican Stock Exchange. The MERVAL tracks the performance of large companies based in Argentina. The ASX 200 Index is an index of stocks listed on the Australian Securities Exchange. The DAX is a market index consisting of the 40 German companies trading on the Frankfurt Stock Exchange. The CAC 40 is a benchmark for the 40 most significant companies on the French Stock Market Exchange. The Dow Jones Russia Index measures the performance of leading Russian Global Depositary Receipts (GDRs) that trade on the London Stock Exchange. The FTSE 100 Index is an index of the 100 companies with the highest market capitalization listed on the London Stock Exchange.
Please consult your financial professional for additional information.
Sources: Investech Research, Washington State DRS